RedThreatAlert — UX Case Study
Turning open-source intelligence into a calm, readable daily signal
- Client
- RedThreatAlert
- Role
- Product Design · Data & Methodology · AI-assisted Development
- Sector
- Public interest / OSINT & Security
- Year
- 2026
Context
Independent public dashboard at redthreatalert.pl, built solo with AI-assisted workflows.
Constraint
Security news is noisy and alarmist; the product had to inform without scaring people or overstating certainty.
My move
Designed the product, the index methodology, the data pipeline and the interface — from source ingestion to daily reports and a newsletter.
Outcome
A live dashboard with daily reports, an operational map, a signal log and transparent methodology and limitations.
/ 01 Problem
A public OSINT dashboard that tracks Russian activity relevant to Poland and NATO's eastern flank — collecting publications, GNSS jamming and aviation data into a daily 0–100 index with a separate data-confidence score.
- 01
Turning many scattered open sources into one clear daily picture without sensationalism.
- 02
Separating how serious a signal is from how confident we are in the data.
- 03
Keeping raw observations (GNSS jamming, aviation, logistics) apart from conclusions they cannot support.
- 04
Building and running a real data pipeline as a designer, using AI-assisted development.
/ 02 Responsibilities
- —Product vision, information architecture and UI
- —Index methodology (score 0–100 plus separate data confidence)
- —Data pipeline: fetch → archive → review queue → database → report
- —Polish-language titles and summaries with originals preserved
- —Newsletter, reports archive and methodology pages
/ 03 Approach & process
- 01
Defined a versioned scoring contract with decay rules so old events fade instead of piling up.
- 02
Built a review queue so every publication is checked before it affects the index.
- 03
Added separate pilots for early signals — GPSJAM measurements, rail logistics and ADS-B aviation data quality.
- 04
Designed an editorial, low-contrast interface: overview, operational map, signal log and reports.
- 05
Wrote clear limitations into the product — the index is not a probability of war or an attack forecast.
/ 04 Selected screens
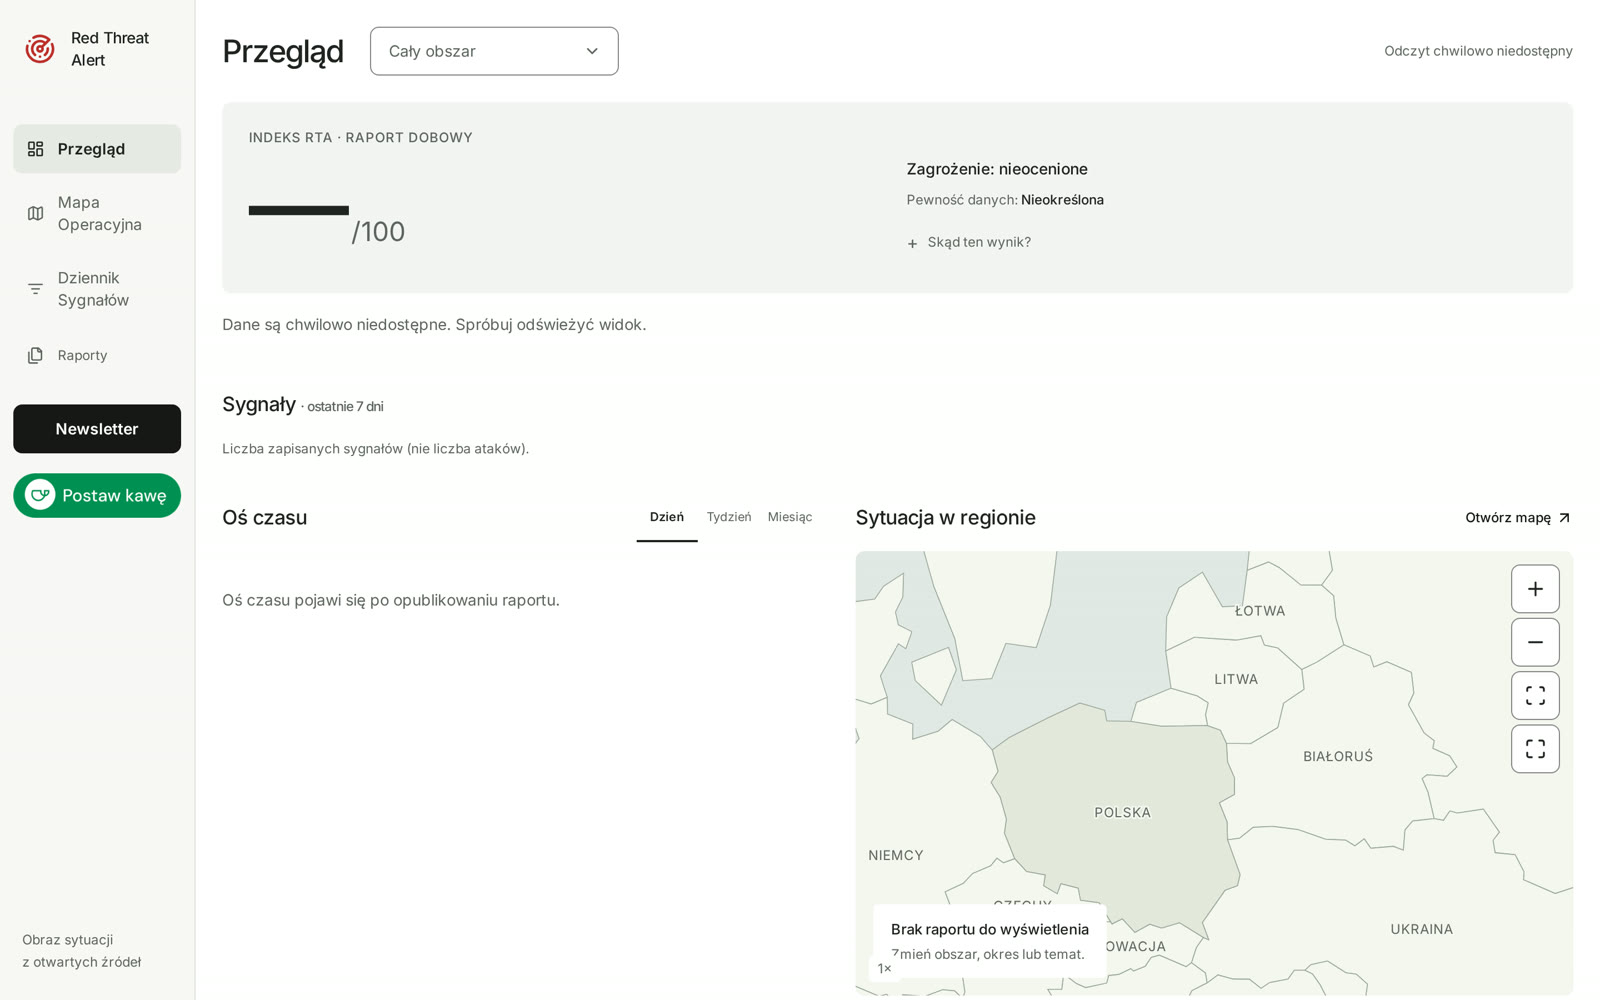
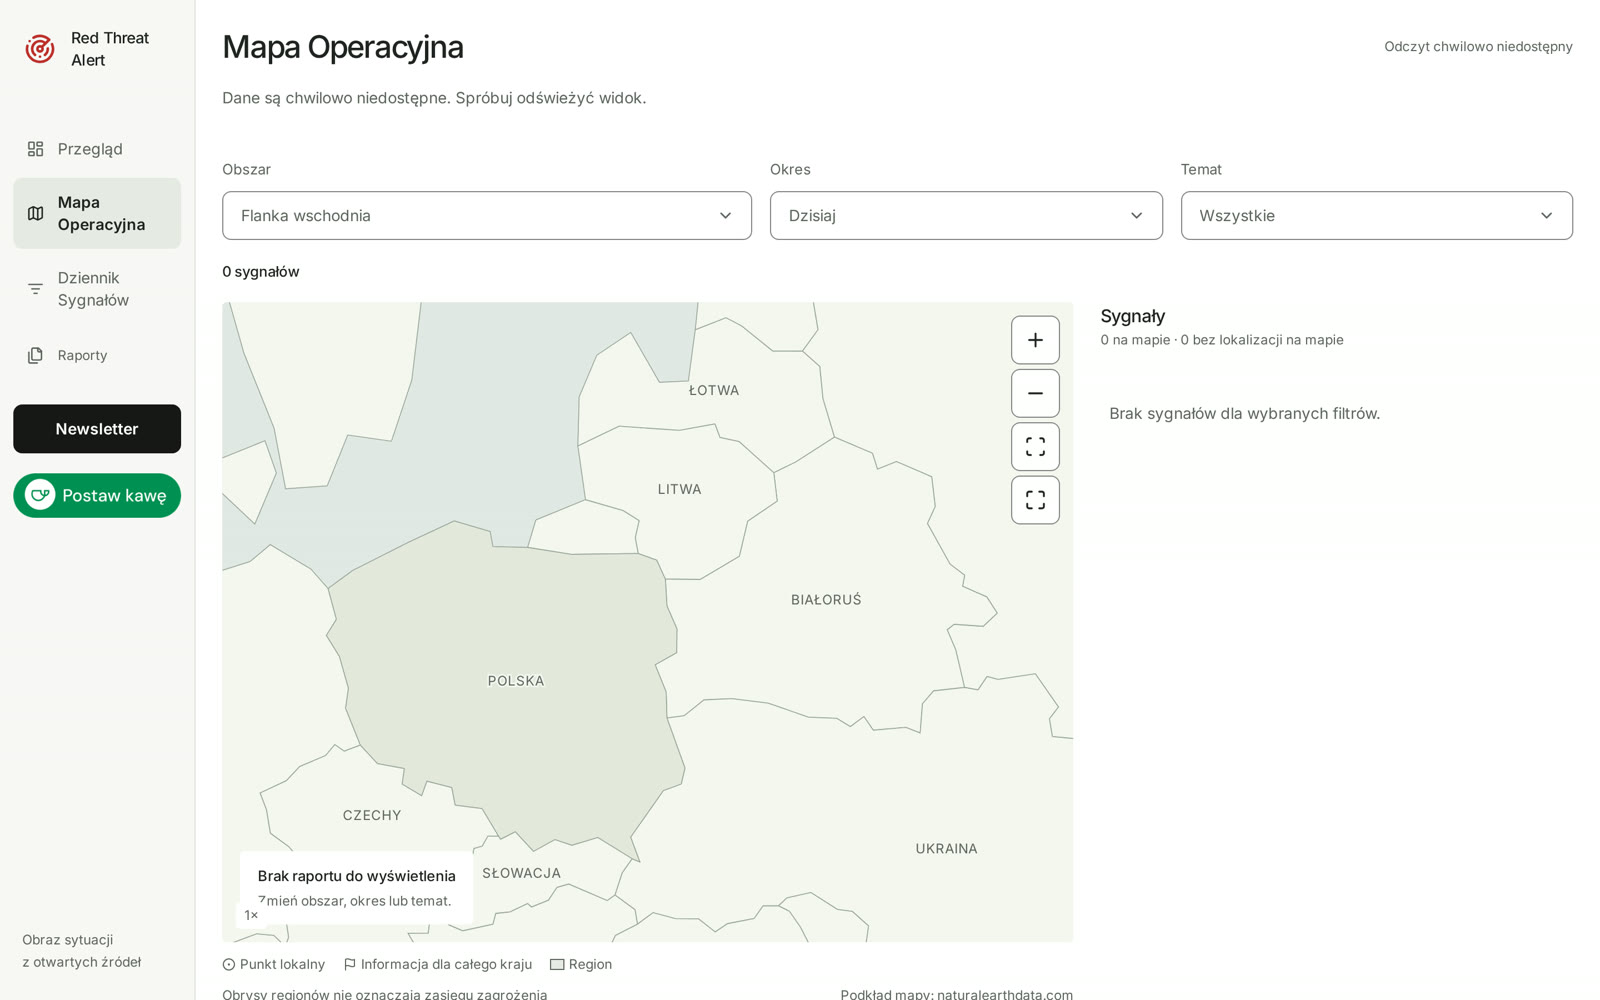
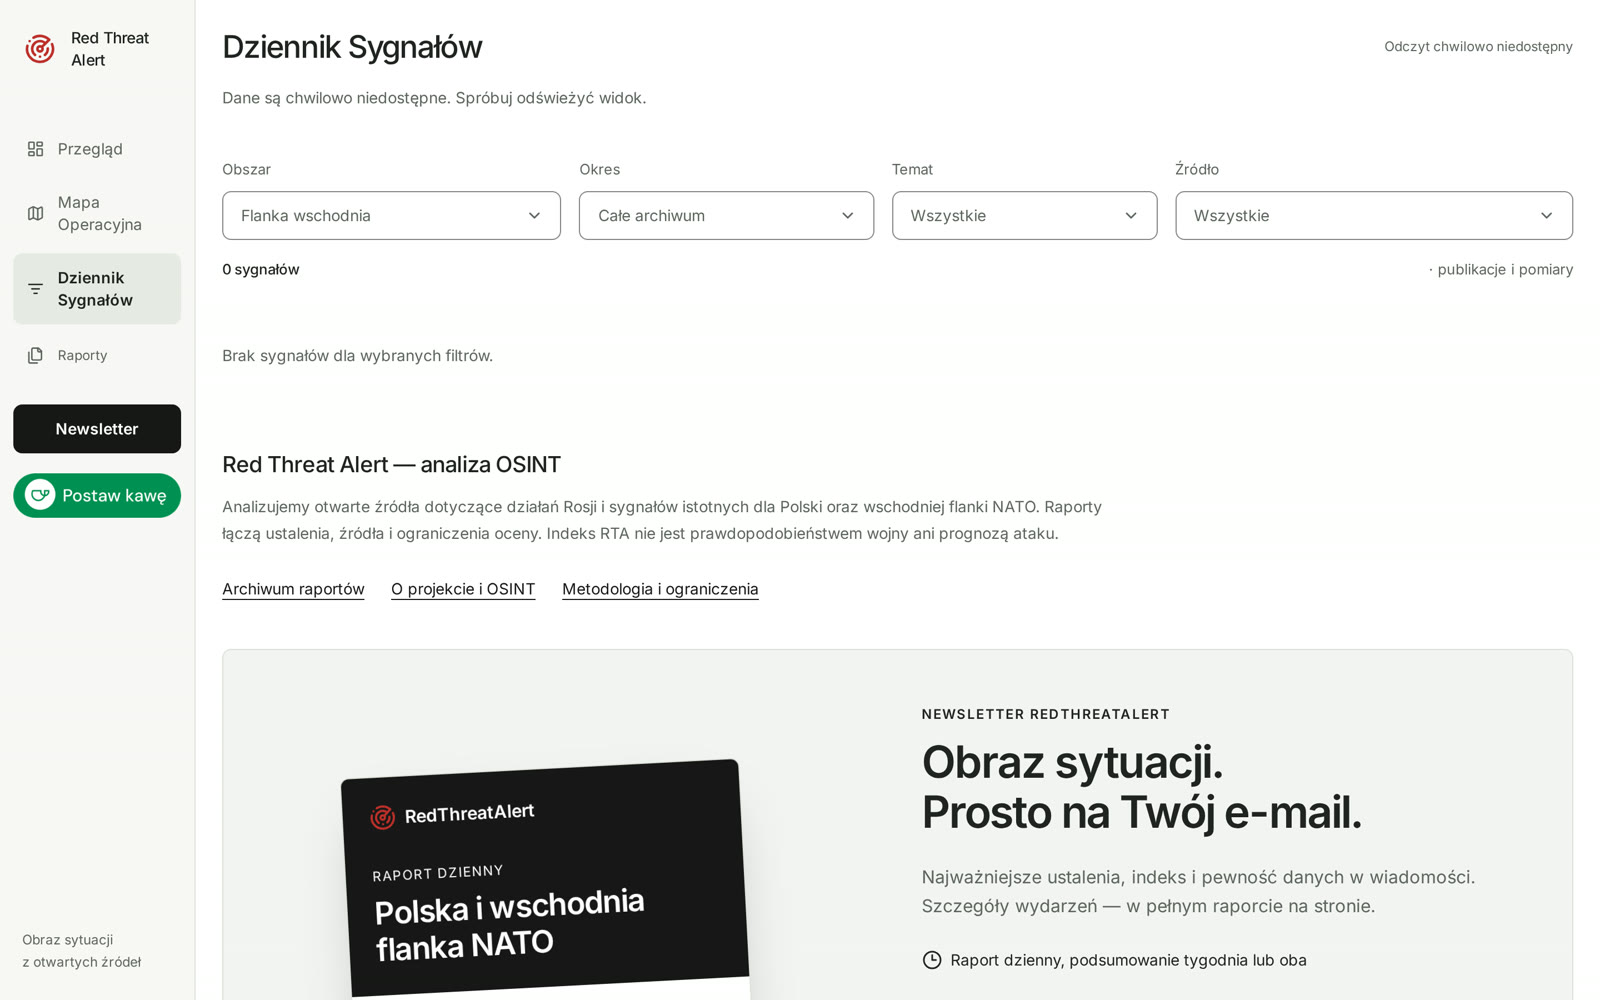
Selected work shown under NDA. Full walk-throughs available on request.
/ 05 Outcome
- →
Live public product at redthreatalert.pl with daily reports and a 14-day history.
- →
A transparent methodology that shows both the score and how much data stands behind it.
- →
Proof that a designer can ship a data-heavy, research-driven product end to end with AI.